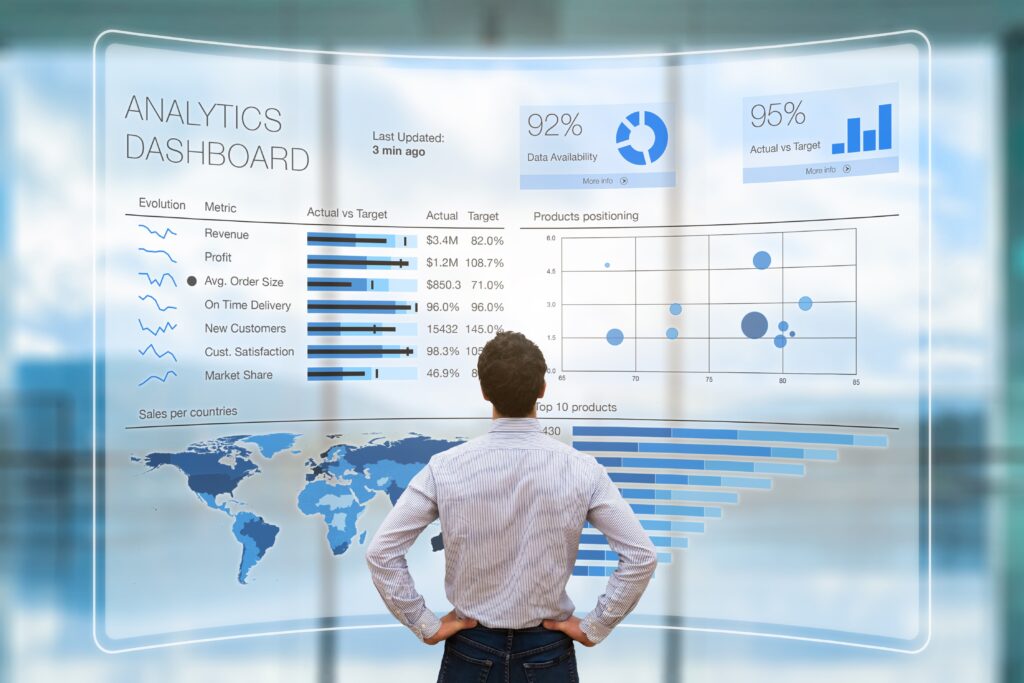
What is Big Data Analytics?
Big data analytics is the process of examining large and complex sets of data. This data process is also known collectively as ‘big data’. Analysis of such vast data helps organizations to uncover patterns, trends and useful information.
This analysis helps businesses to:
- Make better decisions
- Improve efficiency
- Gain insights into customer behavior
- Identify market trends
- Resolve operational issues
What are the components of big data analytics?
Data mining
Data mining refers to the recognition of patterns and connections within large sets of data. It is done to uncover useful insights.
Machine learning
Machine learning helps systems analyze data and improve their predictions.
Data quality management
Data quality management ensures that the data used is clean and accurate. It is essential for producing reliable results.
Data visualization tools
Data visualization tools convert complex data into easy-to-understand visuals. Commonly used tools for this include Power BI and Tableau.

How big data analytics works
Big data analytics involves several steps. Each step is critical to converting raw data into meaningful insights:
Here the steps are presented in table format:
| Step | Description | Common Platforms |
| Data collection | Large amounts of data are collected from various sources like social media, transactions, and business applications. | Social media, transactions, business applications |
| Data storage | The collected data is stored in data warehouses. Advanced storage systems like Hadoop and other cloud storage platforms are used. | Hadoop, cloud storage platforms |
| Data processing | The collected data is processed and organized using advanced tools to handle large volumes quickly. | Apache Spark, data processing tools |
| Data analysis | Algorithms and advanced tools are used to analyze the data, helping to identify trends and patterns. | Data analysis algorithms, advanced analytical tools |
| Data visualization | Insights from the data are presented visually using dashboards, graphs and charts | Dashboards, graphs, charts |
Types of big data analytics
Primarily, big data analytics is comprised of four types.
- Descriptive analytics: This approach uses historical data to understand past trends.
- Diagnostic analytics: Identifies the causes of certain trends. It finds out ‘Why’ something happened.
- Predictive analytics: Analyzes historical data to forecast future trends.
- Prescriptive analytics: Makes recommendations based on the data insights received.
What are the common tools used in big data analysis?
The most commonly used tools for big data analytics are:
- Hadoop: An open-source framework for distributed storage and processing.
- Apache Spark: A versatile data processing engine that supports real time analytics.
- Tableau: An advanced data visualization tool used to make interactive dashboards.
- R and Python: Advanced programming languages used for statistical analysis and data modelling.
- Apache Kafka: A platform for real-time data streaming and integration.
